Sunday, February 09, 2014

As you already know, Parsero is a free script written in Python which helps you to automatically audit the Robots.txt file of a web server. In just a few seconds, you are able to get a lot of valuable information which is needed  when you are auditing a website.

This tool is available for download here:

https://github.com/behindthefirewalls/Parsero

And here you can learn what Parsero already did.

http://www.behindthefirewalls.com/2013/12/parsero-tool-to-audit-robotstxt.html

How to install Parsero v0.6

Parsero is really easy to install. You can install it  for example, in Kali Linux. You only need to run the commands below.
apt-get install python3
apt-get install python3-pip
pip-3.2 install urllib3
pip-3.2 install beautifulsoup4
git clone https://github.com/behindthefirewalls/Parsero.git

What's new?

If you look at the Parsero help, you will see two new features:

  • "-o" :   To only show the available Disallow entries.
  • "-sb" :  To search in Bing indexed Dissallows.

Showing only the available Disallows

In the picture below you will see the difference between using the "-o" option and not using it.

If the robots.txt file has a few entries, I recommend you don't use the "-o" option because you will be able to figure out what type of content the administrator wanted to hide looking if you get all the results. But if the file is bigger, you have a lot of information to analyze and it is easer perform the audit getting only the links which are allowed to be visited.


Searching the Disallows entries in Bing

The fact that the administrator wrote a robots.txt to try to hide the crawlers part of his content doesn't mean that the search engines don't index these Disallow entries.

For example, in the picture below, Parsero will find content indexed by Bing which it mustn't have been indexed. Parsero will show you the first 10 Bing results for the indexed Disallows.

By doing CTRL+ click on the links, your browser will be redirected to:

  • White links: the search page in Bing.
  • Green links: directly to the result found in Bing (the content is not always available and sometimes you will get a 404 HTTP code error).


Posted on Sunday, February 09, 2014 by Javier Nieto

3 comments

Tuesday, February 04, 2014

Kippo features

A few months ago I could get access to a SSH Honeypot called Kippo. Kippo is designed to log SSH brute force attacks and the entire shell interaction performed by an attacker when the attack is successful.

The main features of this software are:

  • To record the usernames and password which the attacker is trying to perform a brute-force attack.
  • To create a valid username/password like "root/root" to offer the attacker a fake filesystem (resembling a Debian 5.0) with the ability to add or remove files and save the command executed by the attacker.
  • To save suspicious files downloaded (via wget) by the attacker.
  • Possibility of adding a /etc/passwd file so the attacker can 'cat' it.

Installing Kali Linux in a Raspberry-PI
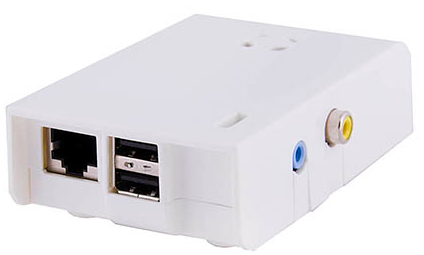
I decided to install Kippo at home. A HoneyNet should be available 24x7x365 because the longer it is available, the more events will be captured.

You already know that a Raspberry-PI is really cheap (around 50$ all included) and it has a lower power consumption. Because of that I will show you how to install it on your device.

Currently, Kali Linux is available for Raspberry-PI. I think is a good idea to install our HoneyNet on it. We will have the opportunity to use all tools hosted in this distribution at the same time our Kippo is running.

You can download Kali Linux for Raspberry-PI here: kali-linux-1.0.5-armel-rpi.img.xz

To install the Kali Linux version connect the SD card to your computer. In my case I have a 8gb SD card and I can detect where it is mounted by using the command below.
sudo fdisk -l

When you already know where your SD card is mounted, execute this command  to copy Kali Linux to the card and wait for a while (the time estimated to copy it will depend on how speedy your card is).
sudo dd if=kali-linux-1.0.5-armel-rpi.img of=/dev/sdb bs=512k

How to install Kippo

We won't only install Kippo, we will also install a MySQL database to save the events and Kippo-Graph to look at these events in a Web interface.

Please, follow the next steps to install Kippo.
sudo apt-get install subversion python-twisted python-mysqldb apache2
1. Install MySQL
root@kali:/# apt-get install mysql-server
root@kali:/# apt-get install mysql-client
2. Create the database and a user named Kippo with all privileges.
root@kali:/# mysql -h localhost -u root -p
mysql> create database kippo;
mysql> GRANT ALL ON kippo.* TO 'kippo'@'localhost' IDENTIFIED BY 'Kippo-password';
exit
3. Download Kippo from http://kippo.googlecode.com/files/kippo-0.8.tar.gz and uncompress it at /usr/local/src/.

4. Create the tables using the user just created.
root@kali:/# cd /usr/local/src/kippo-0.8/doc/sql/
mysql> mysql -u kippo -p
mysql> use kippo;
mysql> source mysql.sql;
mysql> show tables;
exit


5. Add to kippo.cfg the lines bellow.
[database_mysql]
host = localhost
database = kippo
username = kippo
password = Kippo-password
6. Create an unprivileged user to start Kippo and give him access to the folder.
root@kali: useradd -d /home/kippo -s /bin/bash -m kippo -g sudo
root@kali:/usr/local/src# chown -R kippo kippo-0.8/
7. Install the packages required for Kippo-Graph.
sudo apt-get update
sudo apt-get install libapache2-mod-php5 php5-cli php5-common php5-cgi php5-mysql php5-gd
8. Download Kippo-Graph
root@kali:/# wget http://bruteforce.gr/wp-content/uploads/kippo-graph-0.8.tar
root@kali:/# mv kippo-graph-0.8.tar /var/www/
root@kali:/var/www# tar xvf kippo-graph-0.8.tar --no-same-permissions
chmod 777 generated-graphs
vim config.php #enter the appropriate values
sudo /etc/init.d/apache2 restart
9. Start Kippo
root@kali:/usr/local/src/kippo-0.8# su kippo
kippo@kali:/usr/local/src/kippo-0.8# ./start.sh 

With Kippo just installed, you need to publish the service in the Internet. By default, Kippo listens in the port 2222. You can publish it by setting a PAT, I mean,  redirecting in your router the port 22 from the external IP to the port 2222 of the Kippo's internal (private) IP.

Looking at the graphs

To see the graphics, just get access to http://Raspberry-Pi_IP_Address/kippo-graph/

You will see these graphics:

  • Top 10 passwords
  • Top 10 usernames
  • Top 10 user-pass combos
  • Success ratio
  • Successes per day/week
  • Connections per IP for previous month
  • Successful logins from the same IP
  • Probes per day/week
  • Top 10 SSH clients
  • Human activity inside the honeypot
  • Top 10 input (overall)
  • Top 10 successful input
  • Top 10 failed input
  • passwd commands
  • wget commands
  • Executed scripts
  • Interesting commands
  • apt-get commands
  • Top 10 IP addresses probing the system for previous month
  • Total IP addresses probing the system per top 10 countries

Some examples here:


The best feature

In my opinion, the best Kippo feature is the capability of offering the attacker  a fake filesystem and saving the commands which were executed by the intruder by just allowing him to get access to the system when the "successful" attack was produced.

Here you can get several malware samples and new scripts created by hackers. You will have a great opportunity to learn new hacker trends!!!

In the file "/usr/local/src/kippo-0.8/data/userdb.txt" you can set the username/password "allowed" to get access to the fake system. You could set the password "root:0:root" or whatever you want to allow the hacker get access to.


Posted on Tuesday, February 04, 2014 by Javier Nieto

7 comments

Tuesday, January 21, 2014

When we are involved in an incident handling and we are in charge of analyzing a traffic capture in a pcap format related to an attack, one of the things we usually need to do is get the files which were downloaded. The reason is that we need to have a copy of the malware or the exploit to analyze it by reversing engineer or similar... 

We usually detect the original sources where these files were downloaded from just analyzing the pcap file, but they disappear in a short period of time from they were originally hosted. Because of that, we will need to extract them directly from the pcap file.

In this post, I will show you three different ways to achieve this goal using the the pcap hosted in Barracuda related to the www.php.net compromise which can be downloaded here:
http://barracudalabs.com/downloads/5f810408ddbbd6d349b4be4766f41a37.pcap

Wireshark

As you know, Wireshark is the most popular network protocol analyzer. It is capable of extracting all the files which were downloaded and captured.

If you load the pcap file in you Wireshark and use the command below...
http contains "in DOS mode"

... you can check that some executables were downloaded.


We are able to download all files which were downloaded like executables, pictures, javascripts, etc... by clicking File --> Export Objects --> HTTP and clicking on "Save all".


In the picture below shows you the files which are been recovered.


We use the command below to filter only the executables.


If we upload these files to Virustotal, we check that all of them have been categorized as malicious.

NetworkMinner

NetworkMiner is another Network Forensic Analysis Tool (NFAT) for Windows. Also, it can be installed on Linux using Mono. This tool is a great alternative to Wireshark if you just want to extract the files which were downloaded, look at the sessions, discover the DNS queries or get details about the mails detected from a pcap file.

Just loaded the traffic capture file, Network Minner downloads all files from it. Because of that, if you are using an Antivirus, It is possible it warns you if some file is detected as malicious.


You can find the folder where files have been recovered by right-clicking on a file and selecting "Open Folder". In the Picture below you can see this folder.


If we get the SHA256 checksum of the PE files, we can see that the results are exactly the same than using Wireshark. We have got the sames files.

Foremost

Foremost is a well known file carving tool. It was developed by the United States Air Force Office of Special Investigations and The Centre for Information Systems Security Studies and Research and now, it has been opened to the general public.

This tool has been designed to work on image files, such as those generated by dd, Safeback, Encase, etc, or directly on a drive...

Although I usually use Wireshark or NetworkMinner I have read some blogs where they describe how to use Foremost to extract files from a pcap file. For this, I have decided to use it in our example.

Just downloaded we extract all files from the pcap file, we execute the command in the picture below to extract all the files.


We can check that a "/output/exe" folder has been created containing six files.


But the checksum is different than we got with Wireshark or NetworkMinner. It seems like Foremost hasn't work well with the pcap file... For this reason I don't usually use it with a pcap file...


I've uploaded these files to my Cuckoo Sandbox and it seems to be corrupted because the files couldn't run properly...

The VirusTotal links below redirect you to the reports of the corrupted executables:


Posted on Tuesday, January 21, 2014 by Javier Nieto

1 comment

Sunday, January 12, 2014

You can read the first part of this post here:

http://www.behindthefirewalls.com/2013/12/stuxnet-trojan-memory-forensics-with_16.html

DETECTING API CALLS

If we use the command below, we can see the strings of these exported files in order to try to locate some interesting words...
strings evidences/process.*

Thank to Volatility we can find the apihooks of this memory dump. In the picture below, you will see the apihooks related with the malicious process 1928.
python2 vol.py -f stuxnet.vmem malfind apihooks –p 1928


These calls are directly linked to the Stuxnet worm. You can read the article below from Symantec.

http://www.symantec.com/connect/blogs/w32stuxnet-installation-details

DETECTING MALICIOUS DRIVERS

With modscan we can pick up previously unloaded drivers and drivers that have been hidden/unlinked by rootkits.
python2 vol.py -f stuxnet.vmem modscan

The first driver draws our attention… Please, take notes of the “Base” value (0xb21d08000) because we will export it with the command bellow.
python2 vol.py -f stuxnet.vmem moddump --dump-dir evidences/ --base 0xb21d8000

We get the sha256 hash of this driver...
sha256sum evidences/driver.b21d8000.sys


...and we upload it to www.virustotal.com

Here you have the report where you will see that this drivers has been  recognized as malicious.

https://www.virustotal.com/en/file/6aa1f54fbd8c79a3109bfc3e7274f212e5bf9c92f740d5a194167ea940c3d06c/analysis/


We have just detected a malicious driver but I think that it’s necessary to look for more  drivers with a similar name in order to try to find a new ones...
python2 vol.py -f stuxnet.vmem modscan | grep mrx

Ok. Let’s go to export the second suspicious driver. We will follow the same steps as described above.
python2 vol.py -f stuxnet.vmem moddump --dump-dir evidences/ --base 0xf895a000

https://www.virustotal.com/en/file/6bc86d3bd3ec0333087141215559aec5b11b050cc49e42fc28c2ff6c9c119dbd/analysis/


We have just found two malicious drivers: mrxcls.sys and mrxnet.sys.

I checked with the same commands the other two drivers and they aren’t categorized as malicious files. This is the reason I haven't show you.

DETECTING REGISTER KEYS

In this section, we will detect the register keys that have been added to the computer. With the command below, we will see a lot of them.
strings stuxnet.vmem | grep –i mrx | grep -i Services

We can obtain valuable information about some of them with the next commands.
python2 vol.py -f stuxnet.vmem printkey -K 'ControlSet001\Services\MrxNet'

python2 vol.py stuxnet .vmem printkey -K 'ControlSet001\Services\MrxCls'

With these key registers, Stuxnet will be started in each computer restart.


Posted on Sunday, January 12, 2014 by Javier Nieto

No comments

Monday, January 06, 2014

Stuxnet could be the first advanced malware. It is thought that it was developed by the United States and Israel to attack Iran's nuclear facilities. It attacked Windows systems using a zero-day exploit and It was focused on SCADA systems in order to  affect critical infrastructures... Also, it may be spread from USB drivers. It is necessary a squad of highly capable programmers with depth of knowledge of industrial processes and an interest in attacking industrial infrastructure to develop this malware.

Kaspersky Lab concluded that the sophisticated attack could only have been conducted "with nation-state support" and a study of the spread of Stuxnet by Symantec says that it was spread to Iran (58.85%), Indonesia (18.22%), India (8.31%), Azerbaijan (2.57%)....

Thanks to Malware Cookbook we can download a memory dump from an infected host with this malware in the URL below: 

http://malwarecookbook.googlecode.com/svn/trunk/stuxnet.vmem.zip

Ok, let’s go. We are going to analyze it with Volatility.

STUXNET IMAGE INFO

First of all we want to get more info of the memory image. With the command below we can see the volatility suggested profile and when the image was dumped. In this case it was in 2011-06-03.
python2 vol.py -f stuxnet.vmem imageinfo

It is a good practice to export the profile WinXPSP3x86 in order not to specify more this profile in the Volatility commands.
export VOLATILITY_PROFILE=WinXPSP3x86

DETECTING MALICIOUS PROCESS

First of all, I usually want to know what process was running the computer when the memory was dumped.

Notice you will see that three lsass.exe processes were running… It draws our attention.

  • lsass.exe Pid 680
  • lsass.exe Pid 868
  • lsass.exe Pid 1928
python2 vol.py -f stuxnet.vmem pslist

We know that lsass.exe is one of the first processes to start when Windows boots. Because of this, it’s normal that “lsass.exe” has a lower Pid. You can see when the three lsass.exe process started in the picture above:

  • Pid 680 started at 2010-10-29 17:08:54
  • Pid 868 started at 2011-06-03 04:26:55
  • Pid 1928 started at 2011-06-03 04:26:55

You can see the “lsass.exe” with lower Pid (680) started in 2010 and the other ones with higher Pid (868 and 1928) started in 2011. It isn’t a normal behavior.

In the picture below we can notice that Winlogon.exe (Pid 624) started one of the “lsass.exe” process (Pid 680). This is a really good indication of which “lsass.exe” isn’t malicious, because Winlogon.exe always starts the real “lsass.exe”. The “lsass.exe” with Pid 868 and 1928 was started by the “services.exe” process. It isn’t a normal behavior. They could be malicious processes.
python2 vol.py -f stuxnet.vmem pstree | egrep '(services.exe|lsass.exe|winlogon.exe)'

We have just discovered two suspicious processes.

DETECTING MALICIOUS CONNECTIONS

It is really important to indentify if theses suspicious processes were making connections.  With the command below we can check it.
python2 vol.py -f stuxnet.vmem connections

No connections were establishing when the memory was dumped. Now, we are going to see the ports that were listening in the computer.

In the picture bellow you will see a “lsass.exe” with Pid 680 is bound to Port 500 and 4500, while “lsass.exe” with Pid 868 and the another one with Pid 1928 are not listening in these ports. It seems again that the “lsass.exe” with the PID 680 has a normal behavior because this process usually listens on these ports.
python2 vol.py -f stuxnet.vmem sockets

DETECTING DLL

The “lsass.exe” process with PID 680 appears to be a normal process… What’s happened with the other ones?

With the command below, we can check that “lsass.exe” with Pid 868 and Pid 1928 have a load lower DLLs.
python2 vol.py -f stuxnet.vmem dlllist –p 680 | wc –l

python2 vol.py -f stuxnet.vmem dlllist –p 868 | wc –l

python2 vol.py -f stuxnet.vmem dlllist –p 1928 | wc –l


Also, we can detect that the process with Pid 1928 has unlinked DLLs.
python2 vol.py -f stuxnet.vmem ldrmoudles –p 1928

We can get more information about it with this command.
python2 vol.py -f stuxnet.vmem ldrmoudles –p 1928 -v

These kernel calls are directly related with stuxnet worm. See the URL below:

http://www.f-secure.com/v-descs/trojan-dropper_w32_stuxnet.shtml

DETECTING INJECTED CODE

The malfind command helps us to find hidden or injected code/DLLs in the user mode memory. Then we are going to export these DLLs and we will upload them to www.virustotal.com in order to check if an anti-virus detects them.

We already know that the process with PID 680 is normal. For this reason we will continue with the other ones.
python2 vol.py -f stuxnet.vmem malfind –p 868 –dump-dir evidences/

We can see two files have been created. We continue doing the same with the “lsass.exe” process with Pid 1928.
python2 vol.py -f stuxnet.vmem malfind –p 1928 –dump-dir evidences/

The next step will be to upload to www.virustotal.com these files in order to check if some anti-virus vendor detects them as malicious files. In order to not upload the files, we will obtain the sha256 checksum of the files and then we will search on the Virustotal website.
sha256sum *.dmp

Here, you have the links to Virustotal with the report of the files which have been analyzed:

https://www.virustotal.com/en/file/e97d61f7393ac5838a1800f3e9aa22c6205f4d7e2bde494573d35c57bc9b7819/analysis/

https://www.virustotal.com/en/file/163b7da37df4ae6dafbfb5bf88b319dabf7846cee73d4192c6a7593e835857a8/analysis/

https://www.virustotal.com/en/file/abce3e79e26b5116fe7f3d40d21eaa4c8563e433b6086f9ec07c2925593f69dc/analysis/

https://www.virustotal.com/en/file/2b2945f7cc7cf5b30ccdf37e2adbb236594208e409133bcd56f57f7c009ffe6d/analysis/

https://www.virustotal.com/en/file/10f07b9fbbc6a8c6dc4abf7a3d31a01e478accd115b33ec94fe885cb296a3586/analysis/

https://www.virustotal.com/en/file/a4b4b29f0df45283b629203b080c09ddb5bc6eb4cd8e9b725f75121a8b7e728e/analysis/

https://www.virustotal.com/en/file/2b2945f7cc7cf5b30ccdf37e2adbb236594208e409133bcd56f57f7c009ffe6d/analysis/

Notice that the majority of them have been detected as Stuxnet Worm

Stuxnet Trojan - Memory Forensics with Volatility |  Part II

Continue reading the second part here:
http://www.behindthefirewalls.com/2014/01/stuxnet-memory-forensics-volatility-II.html


Posted on Monday, January 06, 2014 by Javier Nieto

No comments